2 Using ggplot in Clojure with ClojisR
| This is part of the Scicloj Clojure Data Tutorials. |
2.1 Setup
We will use ClojisR to call R from Clojure.
(ns using-clojisr
  (:require [clojisr.v1.r :as r :refer [r]]
            [clojisr.v1.applications.plotting :as plotting]
            [scicloj.kindly.v4.kind :as kind]
            [tablecloth.api :as tc]))
2.2 Plotting by calling R code
Let us load ggplot2 at the R runtime:
(r/library "ggplot2")[1] "ggplot2" "Rserve" "stats" "graphics" "grDevices" "utils"
[7] "datasets" "methods" "base"
We will use the mpg dataset, which is part of the ggplot package.
(-> "mpg"
    r
    r/r->clj)
_unnamed [234 11]:
| :manufacturer | :model | :displ | :year | :cyl | :trans | :drv | :cty | :hwy | :fl | :class |
|---|---|---|---|---|---|---|---|---|---|---|
| audi | a4 | 1.8 | 1999 | 4 | auto(l5) | f | 18 | 29 | p | compact |
| audi | a4 | 1.8 | 1999 | 4 | manual(m5) | f | 21 | 29 | p | compact |
| audi | a4 | 2.0 | 2008 | 4 | manual(m6) | f | 20 | 31 | p | compact |
| audi | a4 | 2.0 | 2008 | 4 | auto(av) | f | 21 | 30 | p | compact |
| audi | a4 | 2.8 | 1999 | 6 | auto(l5) | f | 16 | 26 | p | compact |
| audi | a4 | 2.8 | 1999 | 6 | manual(m5) | f | 18 | 26 | p | compact |
| audi | a4 | 3.1 | 2008 | 6 | auto(av) | f | 18 | 27 | p | compact |
| audi | a4 quattro | 1.8 | 1999 | 4 | manual(m5) | 4 | 18 | 26 | p | compact |
| audi | a4 quattro | 1.8 | 1999 | 4 | auto(l5) | 4 | 16 | 25 | p | compact |
| audi | a4 quattro | 2.0 | 2008 | 4 | manual(m6) | 4 | 20 | 28 | p | compact |
| … | … | … | … | … | … | … | … | … | … | … |
| volkswagen | new beetle | 2.0 | 1999 | 4 | manual(m5) | f | 21 | 29 | r | subcompact |
| volkswagen | new beetle | 2.0 | 1999 | 4 | auto(l4) | f | 19 | 26 | r | subcompact |
| volkswagen | new beetle | 2.5 | 2008 | 5 | manual(m5) | f | 20 | 28 | r | subcompact |
| volkswagen | new beetle | 2.5 | 2008 | 5 | auto(s6) | f | 20 | 29 | r | subcompact |
| volkswagen | passat | 1.8 | 1999 | 4 | manual(m5) | f | 21 | 29 | p | midsize |
| volkswagen | passat | 1.8 | 1999 | 4 | auto(l5) | f | 18 | 29 | p | midsize |
| volkswagen | passat | 2.0 | 2008 | 4 | auto(s6) | f | 19 | 28 | p | midsize |
| volkswagen | passat | 2.0 | 2008 | 4 | manual(m6) | f | 21 | 29 | p | midsize |
| volkswagen | passat | 2.8 | 1999 | 6 | auto(l5) | f | 16 | 26 | p | midsize |
| volkswagen | passat | 2.8 | 1999 | 6 | manual(m5) | f | 18 | 26 | p | midsize |
| volkswagen | passat | 3.6 | 2008 | 6 | auto(s6) | f | 17 | 26 | p | midsize |
Here is how we may generate a plot from R code:
(def plot1
  (r "(ggplot(mpg, aes(cty, hwy, color=factor(cyl)))
         + geom_point()
         + stat_smooth(method=\"lm\")
         + facet_wrap(~cyl))"))
Rendering as SVG:
(-> plot1
    plotting/plot->svg
    kind/html)
Rendering as a bitmap image:
(-> plot1
    plotting/plot->buffered-image)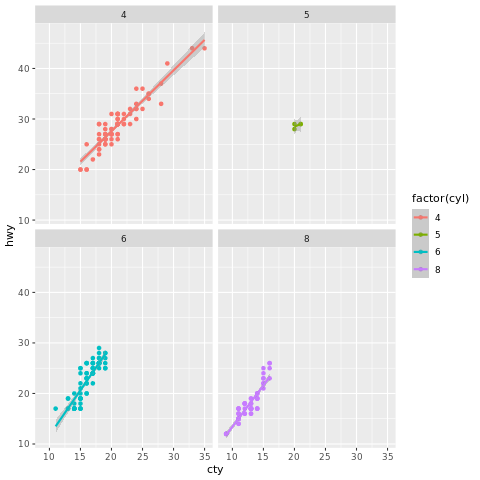
2.3 Plotting by calling generated R code
We may also plot by generating the R code from a Clojure form.
Let us require ggplot as a Clojure namespace.
(r/require-r '[ggplot2 :as gg])nilNow we can plot using code generation:
(-> (r/r+ (gg/ggplot gg/mpg
                     (gg/aes :x 'cty
                             :y 'hwy
                             :color '(factor cyl)))
          (gg/geom_point)
          (gg/stat_smooth :method "lm")
          (gg/facet_wrap '(tilde . cyl)))
    r
    plotting/plot->svg
    kind/html)
2.4 Plotting by calling generated R code with Clojure data
We may further use ClojisR’s code generation with Clojure data.
Let us read the same mpg dataset. At the scicloj.metamorph.ml.toydata.ggplot namespace of metamorph.ml, we have Clojure copies of ggplot’s toy dataset, represented as tech.ml.dataset datasets.
(require '[scicloj.metamorph.ml.toydata.ggplot
           :as toydata.ggplot])
Now we can do the same, but pasing a Clojure dataset:
(-> (r/r+ (gg/ggplot toydata.ggplot/mpg
                     (gg/aes :x 'cty
                             :y 'hwy
                             :color '(factor cyl)))
          (gg/geom_point)
          (gg/stat_smooth :method "lm")
          (gg/facet_wrap '(tilde . cyl)))
    r
    plotting/plot->svg
    kind/html)
Another example:
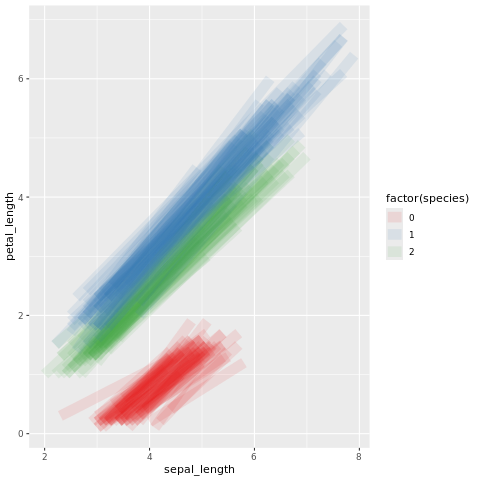
(require '[scicloj.metamorph.ml.toydata :as toydata])(-> (r/r+ (gg/ggplot (toydata/iris-ds)
(gg/aes :x 'sepal_length
:y 'petal_length
:xend 'sepal_width
:yend 'petal_width
:color '(factor species)))
(gg/geom_segment :size 5
:alpha 0.1)
(gg/scale_color_brewer :palette "Set1"))
r
plotting/plot->buffered-image)
Reorganizing the code:
(-> (toydata/iris-ds)
    (gg/ggplot (gg/aes :x 'sepal_length
                       :y 'petal_length
                       :xend 'sepal_width
                       :yend 'petal_width
                       :color '(factor species)))
    (r/r+ (gg/geom_segment :size 5
                           :alpha 0.1)
          (gg/scale_color_brewer :palette "Set1"))
    r
    plotting/plot->buffered-image)